MRI Scans of the Milky Way
The European Space Agency’s Gaia Mission has surveyed the 3D positions of almost 2 billion stars, creating a point cloud that looks more like a sand storm in the Sahara desert than a traditional star map.
How do we visualize such a vast data set?
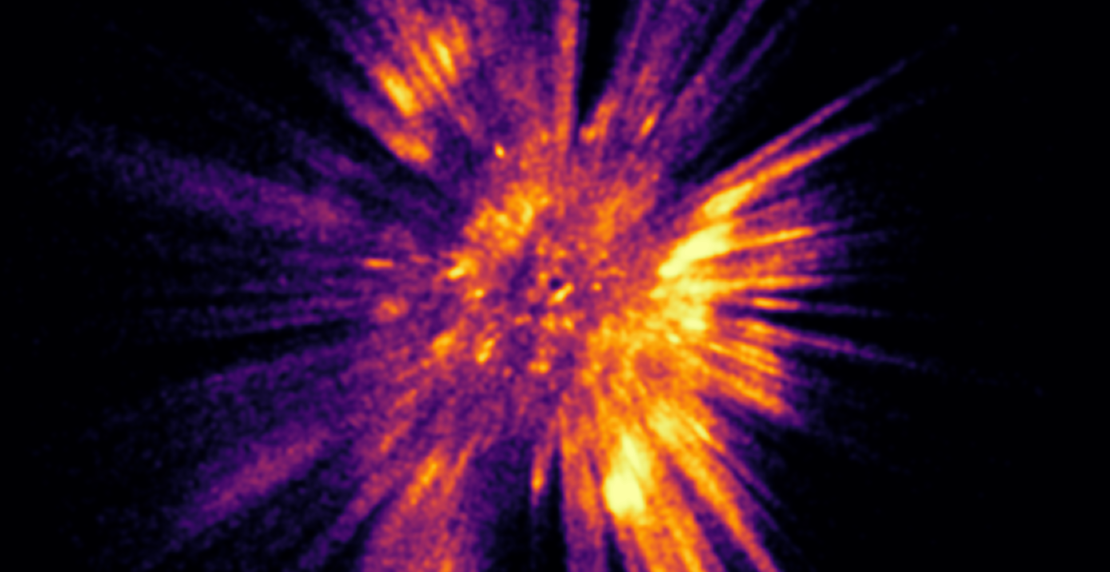
One solution was described in the 2015 paper by Bouy and Alves, Cosmography of OB stars in the solar neighbourhood , which describes a technique to map star density borrowed from algorithms normally used to visualize human tissue density from MRI scans.
Just as MRI scans can distinguish between bones and other tissues based on density, star density analysis can help locate clusters, associations and star formation regions.
Once we have star density slices these can be converted into into 3D meshes using the marching cubes algorithm.

We can combine multiple meshes with different star densities together with dust density meshes and other known objects such as star clusters and HII regions of ionized hydrogen gas to create detailed maps of the Milky Way for the first time.

The maps get more accurate and detailed with each Gaia release. At least two more releases are expected: Gaia DR4 at the end of 2025 and Gaia DR5 at about 2030.
Related Posts
The Phantom Arm
The study of the inner galaxy has a surprisingly controversial history. How could Gaia DR4 help?
Read more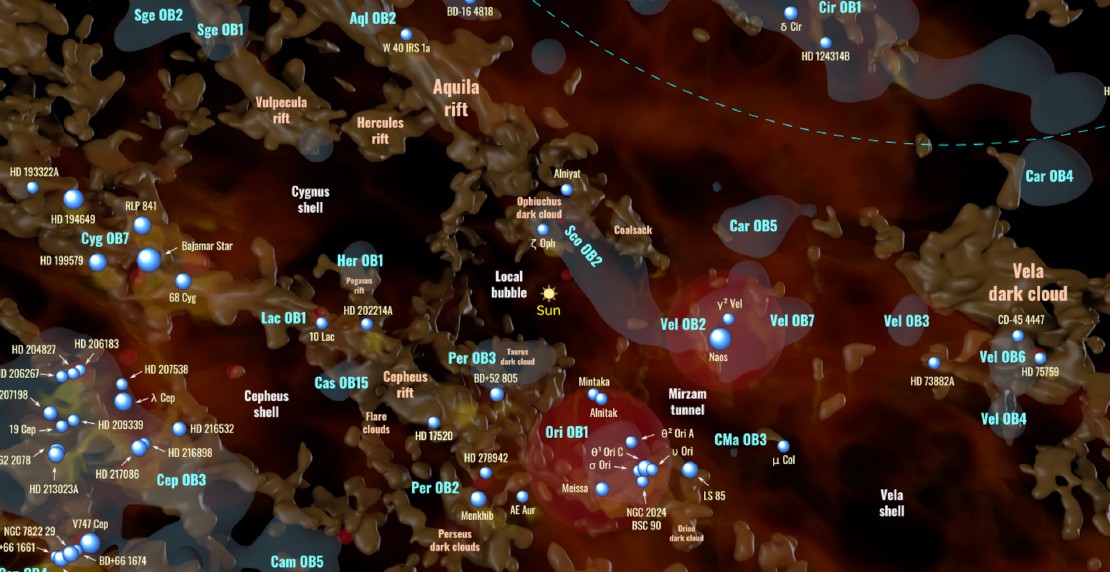
An improved hot star map
The European Space Agency’s Gaia Mission has revolutionized astronomy in many ways. As just one example, the Gaia Mission has provided the first accurate survey of stars in the galactic plane out to about 5 kpc.
Read more
Adventure Engine
Recently I’ve created Adventure Engine, an illustrated text adventure engine for Horizon Worlds.
Read more